Load Testing our BI Server
BIF Technologies provides business intelligence (hereafter BI) to federal organizations, for-profit corporations, and the public through BrainJack™. Our customers (and non-paying community) use BrainJack to transform their data into scheduled reports, alerts, dashboards with customized visualizations, and pivot tables. The services are all delivered via web browsers or email accounts. For example, when users create queries for their databases they use BrainJack Query Manager to create and test the query. When the same users want to create charts, tables, pivot tables, or maps using their queries they use BrainJack BIComponent Studio to create and edit their BI components. And when users are ready to create a dashboard they use BrainJack Dashboard Designer to drag and drop their components into place on a dashboard canvas. Finally, when the dashboard design is ready to be delivered users will share embed code produced in the Dashboard Designer; users can then take the embed code and put it into their site (WordPress, SharePoint, Wix, Drupal, etc).
Each of the aforementioned BrainJack components presents a web-enabled user interface for managing or publishing BI assets. Those web interfaces are dynamically generated by code executing in load-balanced AWS ElasticBeanstalk servers. Each page (e.g., BrainJack Query Manager) is actually produced by the web application (https://brainjack.works) running in Apache Tomcat; Tomcat is running on AWS ElasticBeanstalk servers. The diagram below, for those who like a picture when discussing software architecture, is a summarized depiction of what has been mentioned. Take a moment to review it and make sure that you understand what is says before going on to the section on to Using Apache JMeter to Load Test BrainJack.
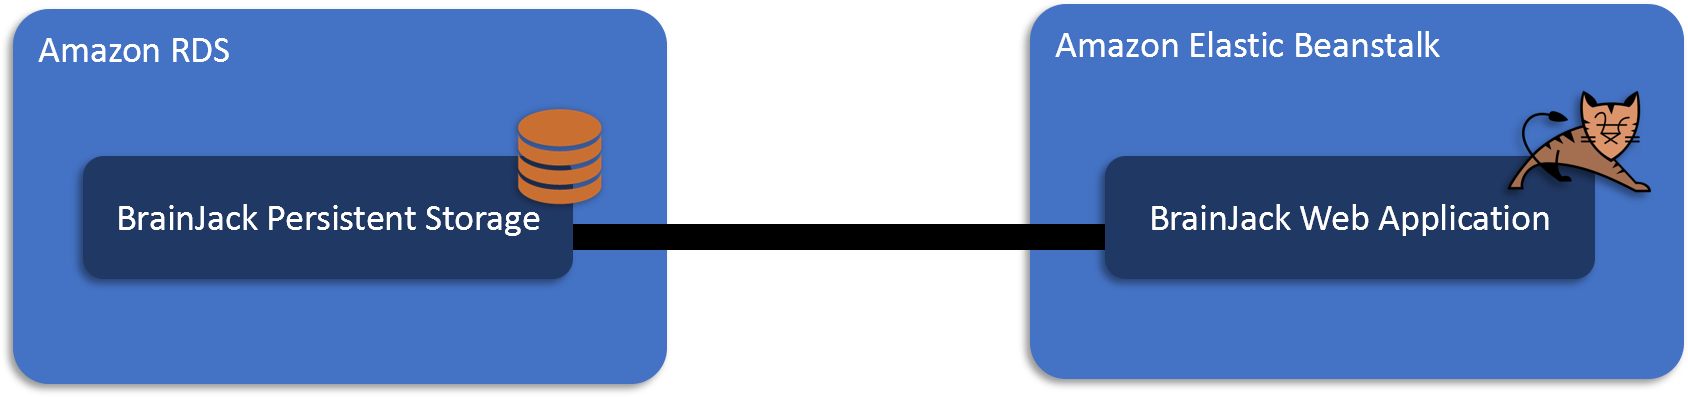
Figure 1: BrainJack is based on AWS Elastic Beanstalk and AWS RDS
Generating BrainJack Query Manager or a dashboard requires resources. Each time an interface is created for a user the server instantiates objects, connects to databases, executes queries, and generates HTML, JavaScript, and images. When the demand gets high it is really important that resources are managed well. Why? Well, things like database connections come in limited supply. If they are not being returned to a pool after use the application can run out. When it does the users will get either slow service or no service at all. Instantiated Java objects use memory. If they are not properly handled and destroyed after use they can linger around in the virtual machine (1) degrading performance and (2) eventually bringing the application server down. Load testing is a developer’s way of proactively discovering resource management issues and determining application scalability before releasing it to the world.
How well does BrainJack Query Manager perform with a single user? (1 user) What happens when the number of BrainJack Query Manager users goes up to ten? (10 users) What happens when that number goes up by a factor of ten? (100 users) Does the application continue to be responsive when there are 1000 users? 10,000 users? The answers to these questions should be known before a release of BrainJack is fielded. Using the this type of knowledge will take the guessing out of infrastructure planning. It can also lead to code corrections that avoid an embarrassing outages due to servers collapsing under the strain of resource leaks. Apache JMeter is a load testing tool that can be used to get these answers.
Using Apache JMeter to Load Test BrainJack
To be sure, there are a lot of load testing products out there. Personally, I like free. That is one of the main reasons why we used Apache JMeter to load test BrainJack. The other reason we chose JMeter is that it is free. Yep. That is the same reason. It is just that important to us. Finally, it comes from the same organization that gives us Apache Tomcat (also free); Apache JMeter was created with the lightweight web application server Apache Tomcat in mind. Here below is what the people at Apache have to say about their own JMeter:
The Apache JMeter™ application is open source software, a 100% pure Java application designed to load test functional behavior and measure performance. It was originally designed for testing Web Applications but has since expanded to other test functions. Apache JMeter may be used to test performance both on static and dynamic resources, Web dynamic applications. It can be used to simulate a heavy load on a server, group of servers, network or object to test its strength or to analyze overall performance under different load types. -Apache JMeter web page
In this article we are going to show you how to use JMeter to load test BrainJack in AWS. Along the way we hope it helps you gain insight into how it can be used to test your own web application. If you have questions about this article or the approach we used for load testing feel free to contact us. We promise to be ardent listeners if you reach out.
Downloading and Running JMeter
To get started we will have to install JMeter. If you already have Java 8+ installed on your machine this will be very straightforward. First, download the binaries. You can get the JMeter downloads using the Apache JMeter distribution page: http://jmeter.apache.org/download_jmeter.cgi. I recommend creating a dedicated set of directories for load testing. In our case we created the directory c:\load_testing\brainjack. Second, unpack the Apache JMeter software into the directory you created (version 5.2). Third, run the jmeter.bat (for Windows) or jmeter (for Unix) file. These launch scripts are found in the bin directory of your JMeter installation. In our case that will be found in c:\load_testing\brainjack\apache-jmeter-5.2\bin. After a short time, the JMeter GUI should appear.
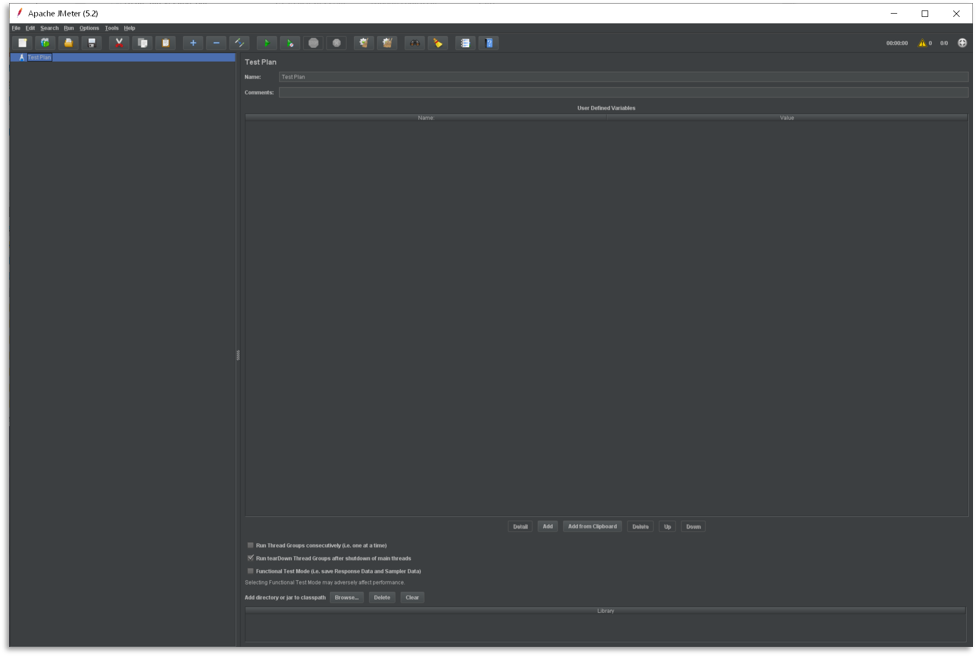
Figure 2: Apache JMeter 5.2 UI
Building Our BrainJack Load Testing Plan for Dashboard Viewer
Adding Users / Thread Groups
The first thing we will do is define the Thread Groups that will simulate users. To do this right-click on the test plan and select the menu options Add → Threads (Users) → Thread Groups. The JMeter application will present a dialog box like the one shown below. Enter the parameters shown here to get started.
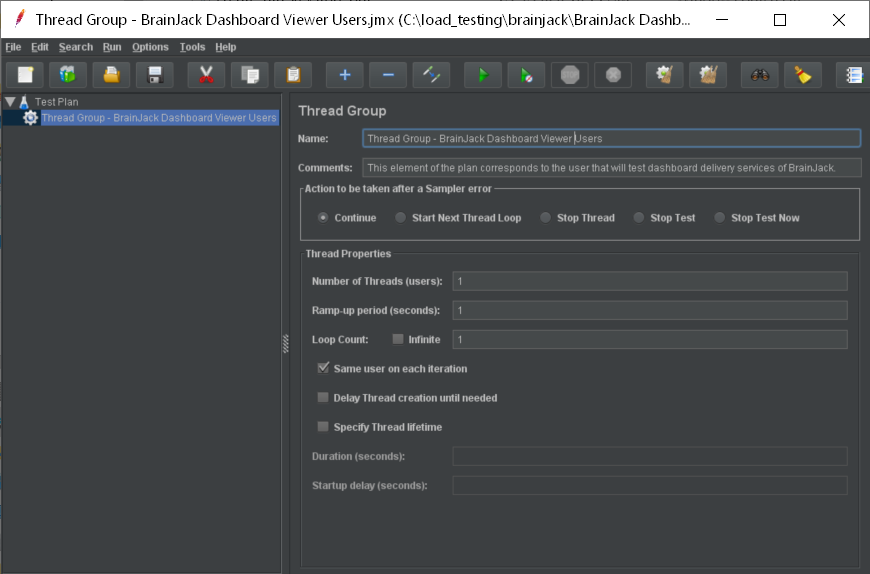
Figure 3: Creating Dashboard Viewer Thread Groups (Users)
Adding HTTP Request Defaults
We have defined our users (thread groups). Now let us provide technical definitions for the tasks that the users will be performing. This will involved (1) specifying the default settings for our HTTP requests and (2) outlining the tasks that are to be performed by the users (thread groups). Default settings are common attributes of the HTTP requests sent out by JMeter-based users. Example default settings would be protocol (e.g., https), server address or host name (e.g., brainjack.works), and port (e.g., 443). By setting up the defaults we eliminate a lot of duplication and make test plans easier to maintain. In Figure 4 we provide what you need to define the HTTP default settings for testing BrainJack’s dashboard presentation.
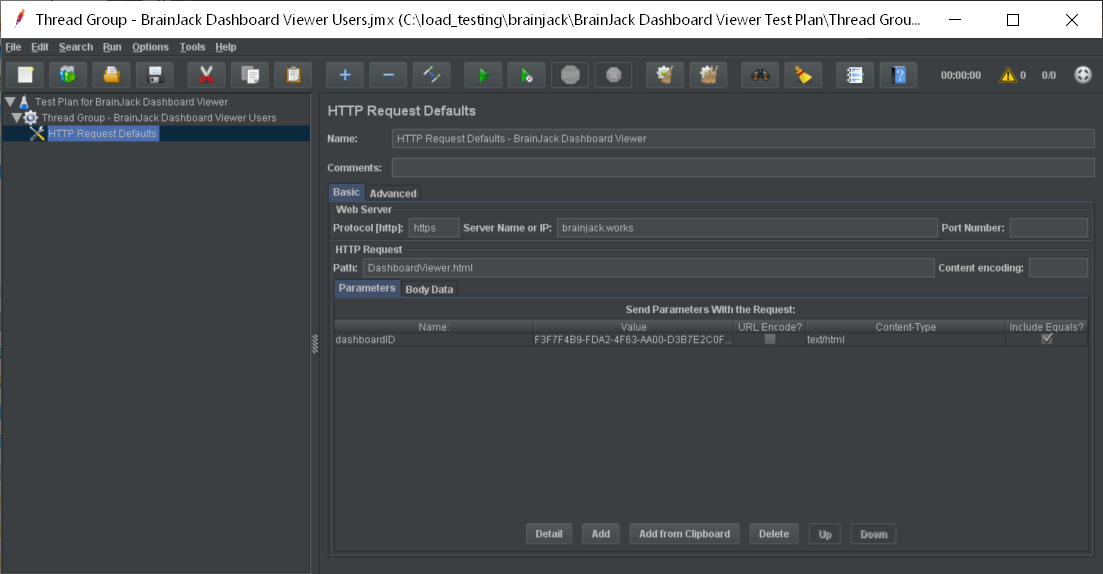
Figure 4: HTTP Request Defaults
To get to the data entry form shown above select the JMeter Users (Thread Group) element; in our case it is called Thread Group – BrainJack Dashboard Viewer Users. Click your right mouse button to get the Add menu, and then select Add → Config Element → HTTP Request Defaults. Select the newly created element in the tree in order to view its Control Panel (See Figure 4). For the test plan that you are building, all HTTP requests will be sent to the same web server, brainjack.works. All communications with the web server are encrypted; Thus the protocol that will be entered is https. Since we are testing a single service we will enter the path: DashboardViewer.html. We will also limit our testing to a single dashboard. To do this we supply a parameter (dashboardID) and a value.
To add the HTTP Cookie Manager, simply select the Thread Group, and choose Add → Config Element → HTTP Cookie Manager, either from the Edit Menu, or from the right-click pop-up menu. Let the policy be Standard.
Adding HTTP Requests
In our Test Plan, we need to load test BrainJack™ as it delivers two different dashboards. Each dashboard is sent back to the user’s browser in response to an HTTP Request. The dashboards being tested are described in the table below.
| Dashboard Name | Description |
|---|---|
| City of San Antonio 311 Call District Dashboard |
Provides a visual depiction of the service calls that came into the City of San Antonio (CoSA) service desks. The data is partitioned by date, district, and service type.
Dashboard URL: |
| Crime Statistics by US Province | This dashboard provides the user with a visual breakdown of crime statistics for the United States across its provinces (states). Data presented in this dashboard can be downloaded from the https://corgis-edu.github.io/corgis/csv/state_crime/.
Dashboard URL: |
| Communion Chapel Speaker History | The history of speaking a San Antonio church is presented as a few charts.
Dashboard URL: |
JMeter sends requests in the order that they appear in the tree. To generate a load test that will cover these three dashboards we will have to create an HTTP Request object for each dashboard URL shown in the table above. We do this by adding adding the first HTTP Request to the JMeter Users element (Add → Sampler → HTTP Request). Then, select the HTTP Request element in the tree and editing the properties (see Figure 4.6):
Set the Path field to “/”. Why? Remember that we do not have to set the Server Name field because we have already specified this value in the HTTP Request Defaults element.
Repeat this process for each of the dashboards that are listed in the table above.
Executing Our BrainJack Load Testing Plan
Test 1 – Executing the BrainJack Dashboard Viewer Load Test Plan (1 User, 1 Request)
Test 2 – Executing the BrainJack Dashboard Viewer Load Test Plan (1 User, 10 Requests)
Test 3 – 10 Users, 10 Requests Each
Test 4 – 100 Users, 10 Requests Each
Test 5 – 100 Users, 100 Requests Each
Test 6 – 100 Users, 1000 Requests Each
Test 7 – 100 Users, 10000 Requests Each
Analyzing Load Test Results
BrainJack Dashboard Viewer Load Test Results
Conclusion
About the Author
 |
Roderick Barnes has worked for federal and private industry crafting business intelligence solutions since 1993. Over the past 20 years he has served at BIF implementing web apps with integrated business intelligence. When he is not programming or speaking he can be found serving with his local church. Roderick and his wife Darlene have been married 25 years and reside in Texas with their six boys. |
References
- Mastering Apache JMeter – From Load Testing to Dev Ops, by Antonio Gomes Rodrigues, Bruno Demion, Philippe Mouawad
- Performance Testing with JMeter 3 – Third Edition: Enhance the performance of your web application, by Bayo Erinle
- Apache JMeter User Manual, http://jmeter.apache.org/usermanual/index.html